ZHN
Nanoindenter, hardness tester and more
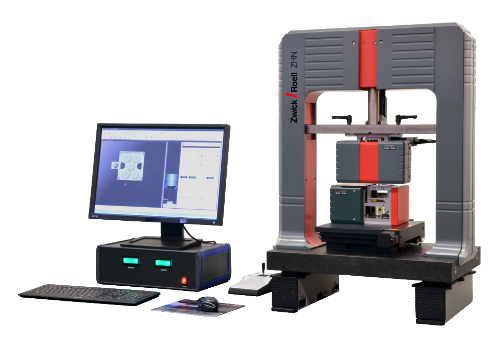
The Universal Nanomechanical Tester ZHN
The Universal Nanomechanical Tester ZHN is an enhancement of the proven ASMEC technique that was sold under the name UNAT.
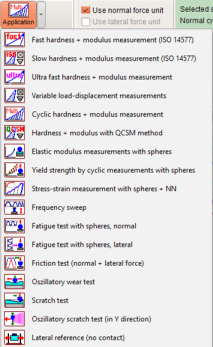
Due to its high modularity it is more than a nanoindenter or hardness tester. In dependence on the configuration it can be used
With one measuring head as:
- Nanoindenter / hardness tester for measurements between 0.02 mN − 20000 mN
- Micro tensile tester in the same force range
- Fatigue tester up to 2 Hz quasi−static or up to 300 Hz with dynamic module
- Dynamic Mechanical Tester (DMA) up to about 100 Hz with dynamic module
- Profilometer and with dynamic module also for stiffness/modulus mapping
- Scratch tester without measurement of friction force
With a second measuring head for lateral force−displacement curves as:
- Scratch tester with measurement of friction force
- Oscillatory scratch tester (oscillation of the sample perpendicular to the scratch direction)
- Micro wear tester for reciprocating wear
- Micro fretting tester (lateral oscillations) with dynamic module
- Tester for high resolution lateral deformations. This allows determining
- lateral contact stiffness
- Poisson’s ratio (new)
- Internal stresses in combination with the software FilmDoctor (new)
- Lateral failure mechanisms
Special features of the instrument, which make the difference to other instruments:
- Very high signal−to−noise ratio of about 106 : 1, so that also measurements with a 2 N measuring head realize an excellent resolution
More
The voltage signal of the inductive sensors (LVDTs) of the ZHN is recorded with AD converters of 24 bit resolution and a frequency of 156 kHz. The effective digital resolution for a maximum acquisition rate of 10 kHz is 28 bit. This corresponds to a resolution of the displacement measurement of better than
0.002 nm.
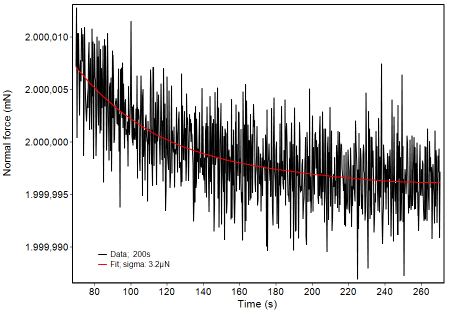
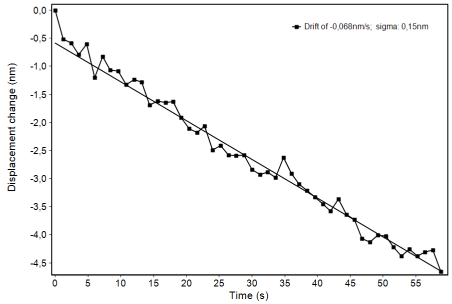
The standard deviation of the noise floor for an acquisition rate of 16 Hz is typically less than 0.3 nm for the displacement measurement and less than 3 µN for a force measurement with the 2 N head. This is the best what could be reached for such a sensor up to now. Smaller acquisition rates will further reduce the noise level. The level is slightly higher at the end of a measurement range.
The big advantages of LVDTs against capacitive sensors consist in a significant larger measurement range of up to 1 mm (for the used sensor type) and a much larger overload protection. Because there are no limit stops like for capacitive sensors, it cannot be destroyed easily during overloading. This makes the ZHN heads so robust.
Fig. 1 is showing the noise level for the maximum force of 2 N over a period of 200 s. In contrast to many other instruments the force signal is measured with a second sensor, completely independent on voltage or current of the actor. The standard deviation of the difference to a fit curve (red) is 3.2 µN. The slight curvature of the curve comes from the feedback control which is quite week for such small differences from the target value.
Fig. 2 is showing the displacement signal during a hold period of one minute for the determination of thermal drift. For a smaller data rate the standard deviation of the displacement noise floor is only 0.15 nm. The thermal drift was -0.068 nm/s.
- Extreme robust measuring head with large tolerance against overloading by using inductive displacement sensors without stopper and a stiff spring system. This allows:
- very fast tip exchange with standard tools and without additional protection measures
- use of unconventional or self−manufactured tips or counterparts and adapters with up to 10 times higher weight than the standard tip
More

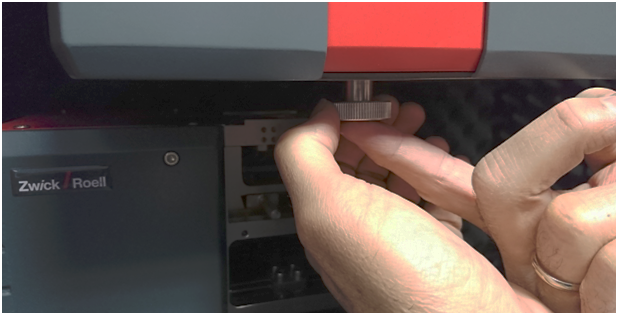
Tip change tool for the ZHN.
The tip can be unscrewed from the measuring head together with an adapter. The tip is sitting well protected in the tool of aluminium (left). Afterwards it is turned together with the adapter by 180 ° in the tool (center) und unscrewed from the adapter with a normal screw wrench (right). In the same way a new tip is installed.
Finally the new tip together with the adapter is screwed in the measuring head (below). For that purpose no additional protection of the head is necessary because the spring system in the head is stiff enough to resist the finger force. For an experienced user a tip change is done in less than three minutes. Afterwards the distance calibration indenter – camera can also be done in less than three minutes with an automatic software routine.
It is not unusual for a ZHN user to change the tip five times daily to carry out different test methods.
- Easy mountable shaft extensions for measurements in holes or liquids
More
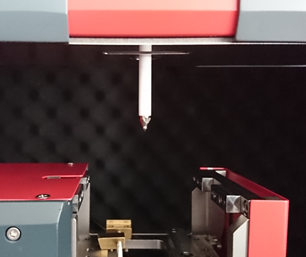
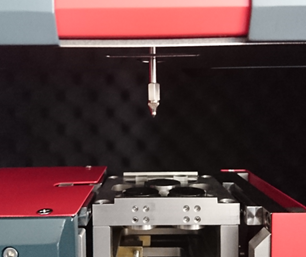
Examples for shaft extensions.
The left image shows an extension made from Macor glass ceramics,
which is mostly used together with the sample heater, and to the right is a steel extension for measurements in holes or slots.
In the same way measurements in liquids are possible.
Users can design and use their own shaft extensions because the measurement range will be kept despite the additional weight.
- Equal functionality in compression and tension. Therefore the instrument can be used as micro tensile tester
- Very stiff frame construction where the indenter axis is below the axis of the Z−stage for height adjustment of the traverse. Therefore no tilting effect may happen when the force is applied.
- Modular concept where the measuring heads for different force ranges (0.2 N; 2 N; 20 N) can be exchanged by the user without difficulties and by using the same plugs.
- Unique patented Lateral Force Unit (LFU) enables very precise measurements of lateral force−displacement curves, which cannot be done with any other instrument. This allows for instance the investigation of the lateral contact stiffness or of stick−slip effects in friction tests and much more. The combined application of both heads allows a better reconstruction of the loading conditions in an application in the laboratory.
More
The Lateral Force Unit (LFU) is a second independent measuring head which allows additional to the normal loading of a surface the application of lateral forces like they occur in many applications. Especially in combination with stress calculations can this be used for a better simulation and understanding of failures in surfaces. The displacement resolution is as good as in normal direction. The fore resolution is somewhat less accurate because the spring force of the holding springs has to be considered.
The patented principle of the LFU is explained in fig. 1. The sample holder is sitting on a holding plate which is fixed in the middle of four perpendicular leaf springs. This construction is very stiff in normal direction so that no noticeable worsening of the normal instrument stiffness takes place. There is no height change of the sample during a lateral deformation of the holding springs by a piezo element of in maximum ± 70 µm. Both movements (normal and lateral) are therefore completely decoupled. The force, applied by the piezo element, is independently measured by another spring system where the spring deformation is determined by an inductive displacement sensor (LVDT) without limit stop. A clamp, which can be closed or blocked by a small motor, enables the force transfer to the sample. In the blocked position it prevents that the sample holder with the sample can move in lateral direction as it is necessary for hardness measurements.
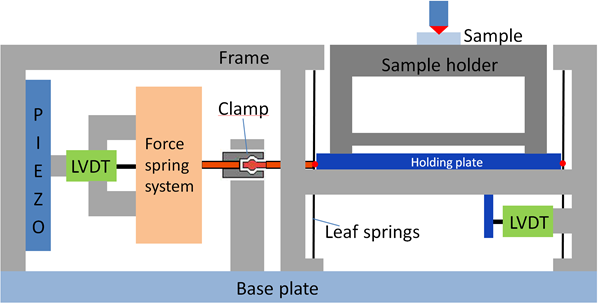
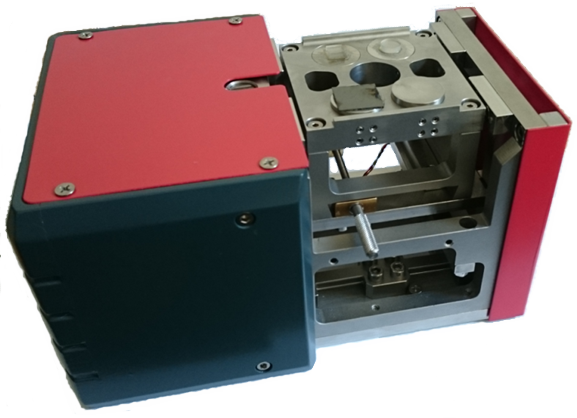
By using this principle a force can be applied and measured even when no lateral displacement takes place (in contrast to scratch testers and other instruments). This is for instance the case when the indenter is adhering on the surface. The transition from sticking to sliding friction can exactly be resolved. For the determination of the frictional force the spring force of the holding springs must be subtracted from the measured absolute force. The exact spring constant is therefore determined before a test series by a measurement against air without contact between tip and sample (figure 3 and 4). The high displacement resolution allows the determination of the elastic deformation in the contact of partially less than 10 nm and therefore the determination of the lateral contact stiffness.
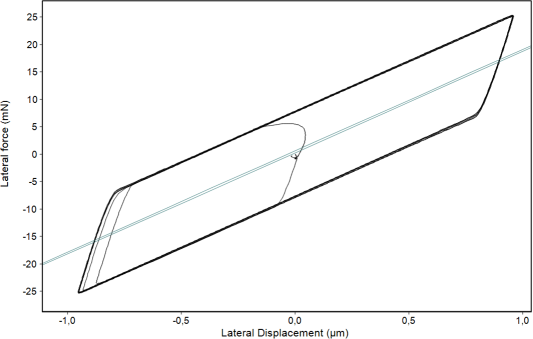
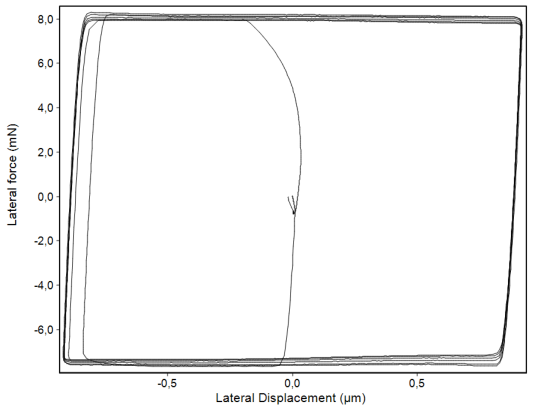
The combination of both measuring heads enables a variety of new test methods. Only one of them shall be shown here as example. It is explained in figure 6 and 7.
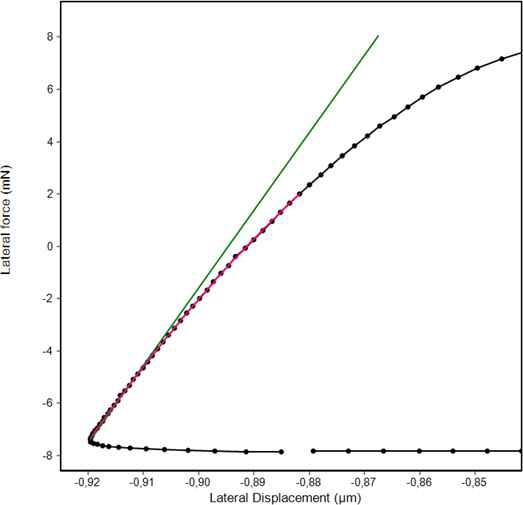
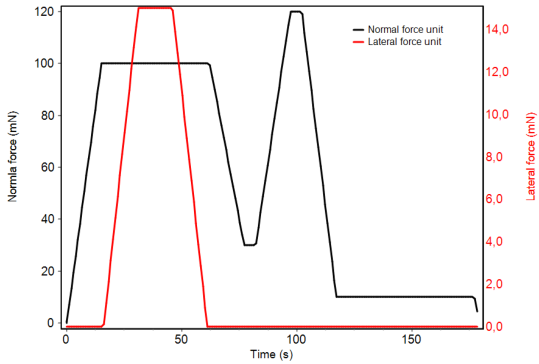
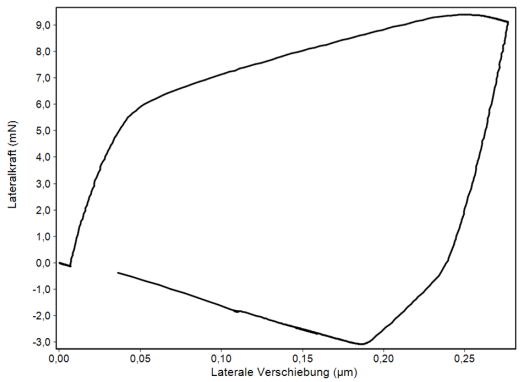
Fig. 7:
Lateral load-displacement curve of a Berkovich indent in fused silica with the sequence of figure 6. After producing a plastic indent by the normal force the indenter is pressed sideways against the indent walls. This results first in an elastic deformation of up to about 5 mN lateral force before the sample is also sideward plastically deformed by about 200 nm. The unloading curve to the right is also purely elastic. This can be used to calculate the Poisson´s ratio with a relatively complex model. Further the yield strength and under certain circumstances also the internal stress can be derived. The necessary calculations for that is not part of the InspectorX software. An additional external software is needed.
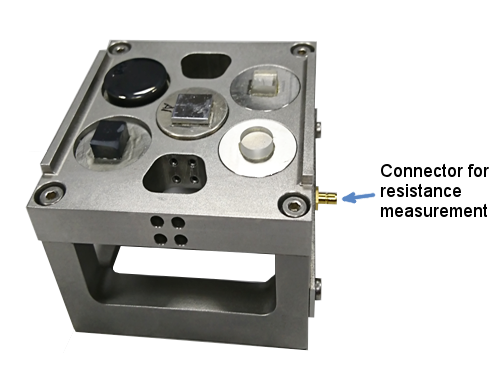
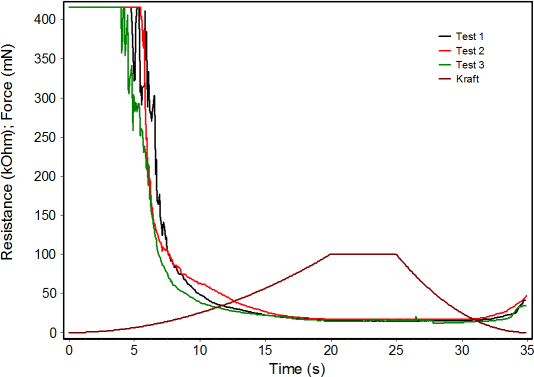
- Standard sample holder with 5 places for samples of varying height and contact for the measurement of the contact resistance between tip and sample (when using conductive diamond or other tip materials)
More
Standard sample holder for up to 5 samples of different height
- 5 nonmagnetic steel cylinders for sample fixing, diameter 24 mm, height 14 mm
- The samples will be fixed by using hard wax
- Compensation of different sample heights of up to 8 mm
- If possible the sample surface should be adjusted at the upper sample holder edge
- Isolated holder top for measuring the contact resistance between tip and sample
Further information about ZHN sample holders you can find here: Sample holders for the ZHN
- Large travelling distance of 70 mm in Z direction (height), so that high samples can be measured. Without the second measuring head (LFU) even samples with a height of 20 cm and a length of 50 cm can be installed and measured. The large available space gives enough room for additional installations.
- Unique optics with a maximum magnification of 3250x (76 nm per pixel) and two cameras for different magnifications without the need of turning a turret. This gives a high positioning stability.
- Unique tip check module for the daily instrument check for instance within a quality insurance system. It is using a permanently installed fused silica sample on a separate place so that no sample has to be exchanged. The software saves in a database where measurements have been done.
More
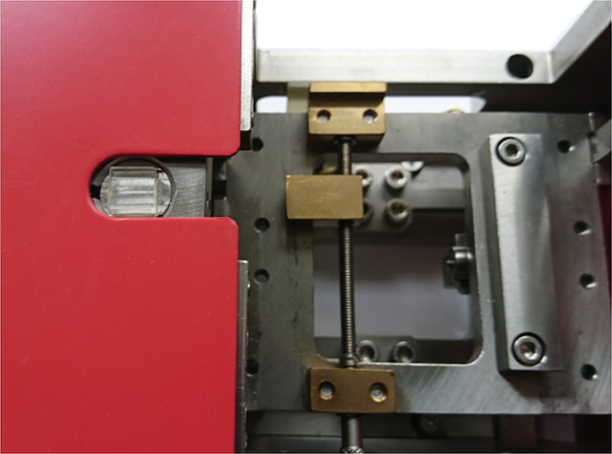
The Tip Check module of the ZHN enables an automated control and documentation of instrument and indenter status. For this purpose an additional fused silica sample is always fixed on the same place in a separate sample holder so that no sample exchange is necessary. The figure shows this for the LFU but also without LFU such an additional holder is available. The software remembers where measurements have been done. On one 8 x 8 mm² is enough place for 5.000 indents in a distance of 100 µm or 20.000 in a distance of 50 µm. Free positions are marked by green dots while red dots indicate the used positions.
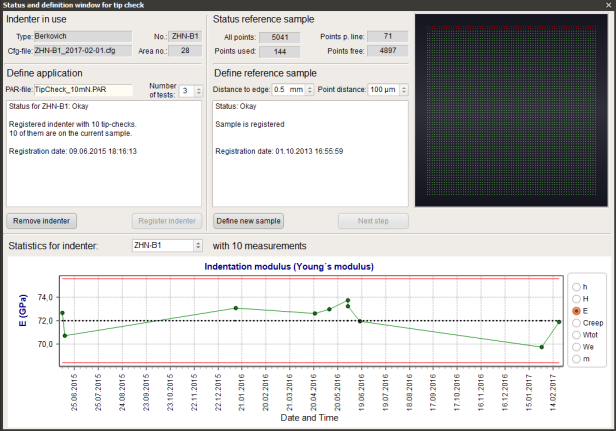
For every indenter an application and the number of tests can be defined which shall be used for the tip check. Typically 3 tests are enough. It is recommended to use a small force, e.g. 10 mN, to identify a tip rounding or defect early enough.
After the automatic averaging and analysis of measurements it will be checked if the modulus of fused silica of 72 GPa is reached within certain limits. Also other parameters like hardness or indentation depth can be checked. The results will be shown in a chart and saved in a (protected) database.
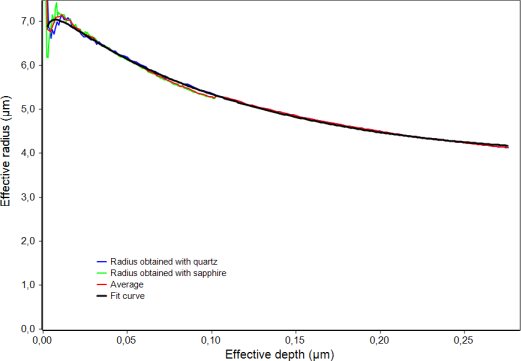
- Very precise routines for the determination of the area function or the radius function for a spherical tip and the instrument compliance function (not only a force independent value is used). As the only instrument it allows the calibration of the area function with two different materials at once to exclude any material dependency.
More
For accurate measurements it is necessary to determine the area function of the indenter and to check its validity in short intervals because also diamond is wearing.
The standard DIN EN ISO 14577-2 annex C distinguishes between direct and indirect calibration methods.
In the direct method the indenter is scanned with another instrument, mostly with an Atomic Force Microscope (AFM), and the projected area is calculated in dependence on the outermost tip. This method is not often used because another accurate instrument is necessary.
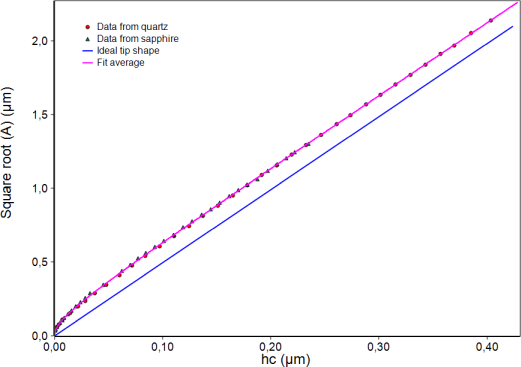
In the indirect method the projected area is calculated from load-displacement measurements of a reference material with well-known modulus and Poisson’s ratio. The reference material further should have a very small roughness, high homogeneity and should not show pile-up or sink-in effects. Mostly fused silica is used.
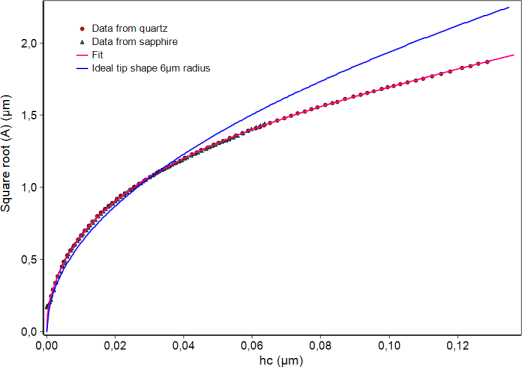
The result for the area function must not be material dependent. The only possibility to check this is the measurement of another reference material with distinctly different modulus. For the ZHN sapphire single crystal is used for that. For both materials the area functions must agree.
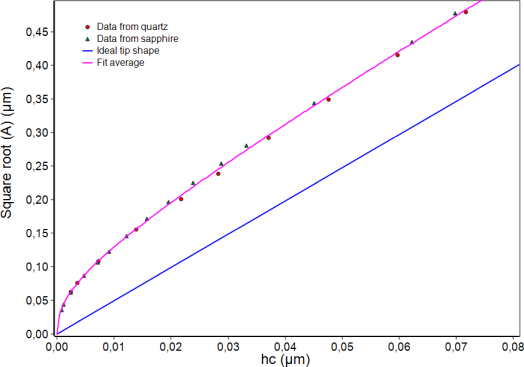
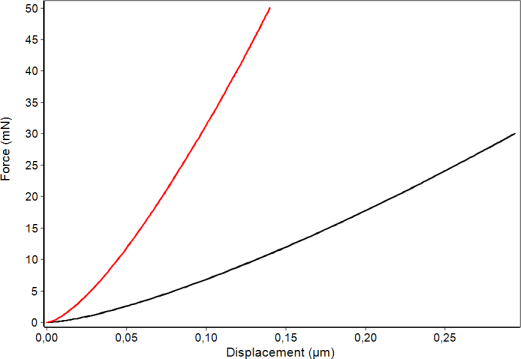
The software of the ZHN is the only one which is prepared for the use of two reference materials and their comparison. The comparison further enables the calibration of the instrument stiffness or compliance in the same procedure. Further radial displacement correction and variable epsilon factor are used by default.
- A precise optional dynamic module enables the superposition of oscillations up to 300 Hz and the measurement of amplitudes and phase shift. The continuous or quasi−continuous contact stiffness measurement allows a depth dependent measurement of hardness and modulus already for depths of only 10 nm. One−of−a−kind is the large amplitude range of more than 50 mN force amplitude so that the instrument can be used for fatigue tests.
More
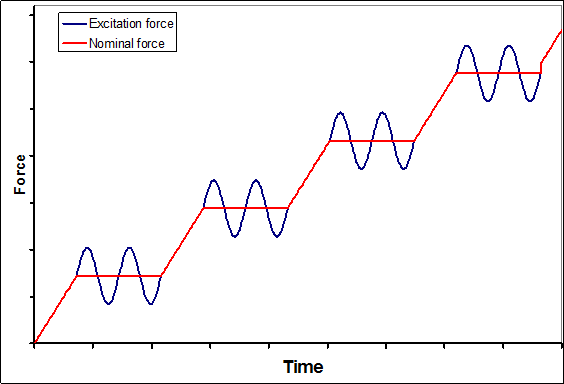
The Continuous Stiffness Measurement (CSM) method, as it was invented by Nanoinstruments more than 20 years ago, adds a continuous small oscillation to the force signal (fig. 1). The ratio of force and displacement amplitude delivers the contact stiffness between indenter and sample after some corrections which consider moving mass, frequency and damping coefficient.
In the CSM method is the static force during loading for every oscillation slightly different. This complicates the averaging of several oscillations and the feedback control. The ZHN is also able to measure with the CSM method.
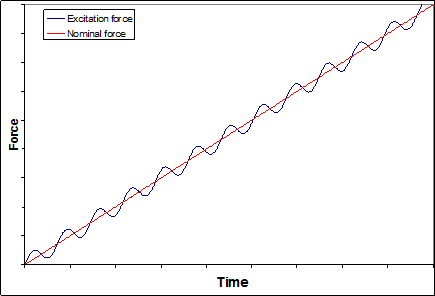
ASMEC has developed a somewhat different method which is called Quasi Continuous Stiffness Measurement (QCSM). In this method the force is increased in small steps and the oscillation is only switched on during a short dwell time between about 0.5 s and 3 s (see fig. 2). This allows an easy averaging of several oscillations and also the feedback control is more accurate. For example there are amplitudes from 56 oscillations measured at a frequency of 40 Hz and a dwell time of 1.4 s. In the QCSM method the first 20 % of the measured amplitudes are not considered for averaging to reduce the creep influence on the results. This is especially important for viscous materials.
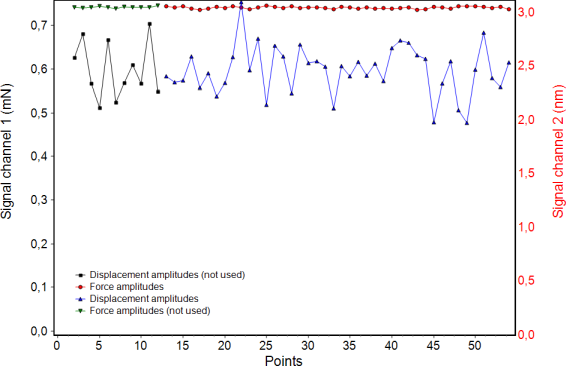
Figure 3 shows an example. There are all measured amplitudes visible during a 1.4 s dwell time in one force step of a Berkovich indentation into sapphire. The displacement amplitude was chosen small do demonstrate the resolution and to disturb the measurement as less as possible. For a comparison with other instruments it has to be considered that the maximum amplitude is given in the ZHN software and not the root mean square value. The following results are obtained:
Displacement amplitude: 2.46 nm; standard deviation 0.22 nm; statistical error 2.8 %
Force amplitude 0.741 mN; standard deviation 0.0025 mN; statistical error 0.1 %
The accuracy can further be improved by a longer dwell time or larger amplitude.
The CSM as well as the QCSM method allow a depth-resolved measurement of hardness and modulus at one and the same position. Therefore much more information can be generated than with normal indentation measurements. The default value for the force step number in a QCSM application is 30. This corresponds to measurements with 30 different forces. Further the accuracy of QCSM measurements is higher at very small forces. With the 2 N measuring had it is therefore possible to measure accurate data at only 100 µN or 10 nm depth.
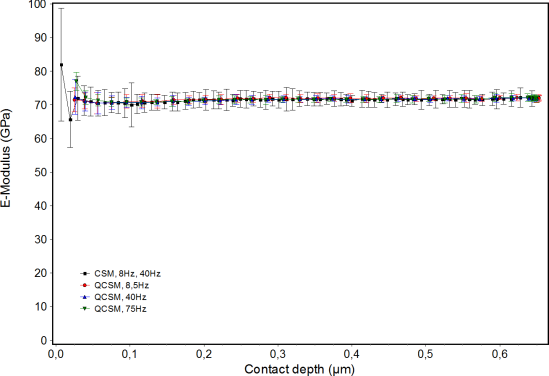
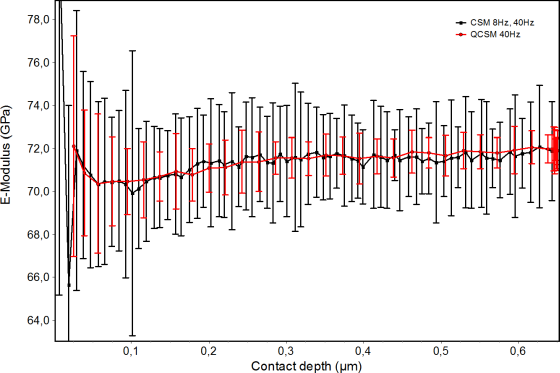
The results of the QCSM method are independent on the frequency up to about 75 Hz (in dependence on material and indenter shape). This is demonstrated in fig. 4 for fused silica measurements. The curves for the depth-dependent modulus have been obtained by averaging 6 single measurements. The error bars show the statistical error. A more resolved comparison between CSM und QCSM method in fig. 5 shows that the error of the CSM is clearly larger for the same frequency of 40 Hz.
A separate application allows a frequency sweep for the determination of the frequency dependent e-modulus of viscous materials. Fig. 6 demonstrates this for the measurement of an elastomer with the name Affinity. In this case correct measurements up to 100 Hz have been possible by using a big ball of 7 mm diameter as indenter. DMA data up to 20 Hz have been available for the same sample so that a comparison was possible. Considering the different contact geometry in an indentation experiment and a DMA test the results agree very well.
Another speciality of the ZHN is that quite big force amplitudes of 50 mN or more can be generated during oscillations. This allows fatigue tests even with higher frequencies than 75 Hz because no contact stiffness needs to be calculated.
Fig. 7 shows an oscillation of the indenter in air with a frequency of 10 Hz and an acquisition rate of 512 Hz with the oscilloscope function of the instrument software. Always 512 points are used in the graph. Since the data are continuously updated there is always a jump in the curve visible (here at 0.9 s) which does not have any consequences.
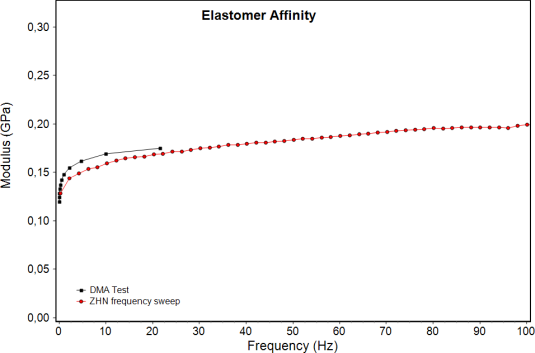
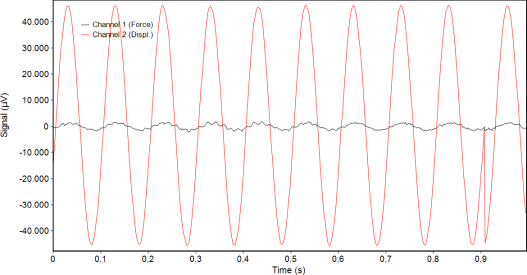
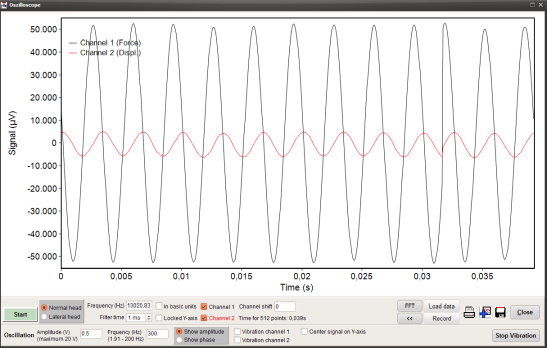
Figure 8 shows the complete oscilloscope window with the maximum oscillation frequency of 300 Hz also for oscillations in air. The acquisition rate was 13 kHz here. The maximum acquisition rate of the ZHN is 40 kHz. Due to the inert mass of the oscillating parts the system cannot follow quickly enough so that the force signal becomes significantly larger than the displacement signal. After contact with a stiff sample the amplitude ratio will change. This example demonstrates nicely the independency between force measurement and force generation for the ZHN head. The indenter can oscillate freely and is not damped by the actor (piezo element)
- A multitude of additional modules is available like
- White light interferometer (optical profilometer)
- Atomic force microscope (AFM)
- Sample heater up to 400 °C
- Sample cooler down to −10 °C


